|
How should a new flow assay be validated? This seems like a simple question, but it’s difficult to find a simple answer. Everyone involved in research or clinical flow cytometric testing wants to be sure that the results they generate are correct, but there’s no standard way of doing this. Several flow cytometry experts are meeting to come up with recommendations for Laboratory Developed Tests (LDT) and hopefully there will be more information available later this year. In the mean time, and in an attempt to get you engaged, I will describe the things I consider when introducing a new flow cytometry tube. These thoughts are my own, based on my own experience directing clinical flow cytometry and hematology laboratories, and do not reflect those of the Society. I have included some resources that I have found useful. Please feel free to comment. Is this what you do? Are there any other resources you would like to share with other members of ICCS?
1. Purpose of the Tube.
It’s important to determine the expectations of a new tube before initiating the design and validation process. What are the analytical goals and therefore, what are the requirements for precision, accuracy, sensitivity, analytical range, and turn-around-time? Answers to these questions will help with subsequent steps, including selecting antibodies and reagents, determining an analysis strategy and deciding what to report. At this point in the development process it is important to come up with a plan of what needs to be done, what level of expertise is required i.e. who can do it, and your expected timeline. Include all of the steps required prior to implementation, such as writing the standard operating and control procedures, training, competency evaluation, and proficiency testing.
To illustrate the things I consider when developing a new flow cytometric tube I will refer to a current example from my laboratory. The purpose of this example tube is to identify minimal residual B-lymphoblastic leukemia in bone marrow specimens that may contain hematogones. I’m performing this development work at my institution in collaboration with Dr. Miroslav Djokic and Ms. Wendy Miller.
2. Antibody Selection
I start by select antibodies that will achieve the purpose of the tube, without consideration of what is commercially available. After reviewing the literature, consulting other laboratories, and taking into account prior in-house experience, the following antibodies were selected for our B-LL MRD tube: CD45, CD19, CD20, CD10, CD38, CD34, CD13&CD33, and CD58. Several other antibodies were considered but, in the absence of sufficient published evidence, future head-to-head evaluation will be necessary to determine if they are superior.
3. Selection of Other Reagents.
When adding a new flow cytometry tube to an existing procedure, the selection of other reagents is usually limited to deciding which fluorochrome to pair with each selected antibody. Validation of a completely new flow cytometric procedure would require more extensive testing and is not covered in this article. When performing four color flow cytometry I just focused on combining fluorochromes that I would expect to yield a bright signal with antibodies used to detect low antigen density e.g. CD5 and CD10 coupled with phycoerythrin (PE) or allophycocyanin (APC) for the sensitive detection of CD5 or CD10 expression in B-cell lymphoid neoplasms. However, the selection process is more difficult when using greater than 4 colors, primarily because some of the fluorochromes available have less than optimal characteristics, such as relatively weak signal intensity and the potential for interference with other fluorochromes. As Brent Wood describes in his presentation, some interfering factors to consider when designing a multicolor experiment include spectral overlap, emission from the primary fluorochrome in a tandem reagent (tandem breakdown), direct laser excitation of the secondary fluorochrome in a tandem reagent, and non-specific binding of fluorochrome. Therefore, it is important to review the characteristics of each of the fluorochromes being considered. For my particular set-up, some of the possible sources of interference include: PerCP-Cy5.5 interfering with detection of PE-Cy7, APC with APC-H7, PE-Cy7 with APC-H7, APC-H7 tandem breakdown with emission from APC, PE-Cy7 breakdown with emission from PE, APC-H7 reagent aggregates, and background fluorescence of cyanine containing dyes.
Although it may be necessary to try several different fluorochrome/antibody pairs to see if they meet expectations, it often helps to consider how each antibody is going to be used, the staining intensity expected on normal and abnormal cells, and the key features that will be used to distinguish cells i.e. is it important for this application to be able to distinguish cells based on small differences in staining intensity or to identify weak intensity antigen staining? Using the answers to these questions, I then use the following strategy to pair antibodies and fluorochromes for my particular set up: pair the fluorochromes with the brightest signal (PE, APC, and PerCP-Cy5.5) with the antibody with the lowest expected staining intensity or the antibody for which it is important to be able to distinguish cells based on differences in staining intensity, use a fluorochrome with a weaker signal for CD45, avoid possible sources of interference where they would limit interpretation. I often struggle with identifying the optimal combinations, and it is inevitable that some compromises have to be made.
For our example tube: B-cells will be identified with staining for CD19 (bright intensity on normal and most B-LL cells); CD45 is used to separate basic cell types and can tolerate a weaker fluorochrome; hematogones will be identified with their expected staining for CD38 (moderately bright) and characteristic maturation pattern with CD10 and CD20 i.e. it is important to be able to distinguish a range of intensity of staining for CD10 (negative to bright) and CD20 (negative to intermediate); identification of CD34 staining is useful when present, but may be weak, and therefore should be paired with a brighter fluorochrome; aberrant expression of the myeloid markers CD13&CD33 is often weak and should also be paired with a brighter fluorochrome; I have limited personal experience with CD58, but others have reported adequate staining with FITC conjugated antibodies.
After determining the preferred fluorochrome / antibody pairs, I review what is commercially available, try to select ASR reagents and try to avoid custom reagents because of issues related to cost and lead time required for manufacturing. Combining theoretical considerations and available reagents, it was decided to start by testing the following combination for our example tube: CD20 V450, CD45 V500, CD58 FITC, CD13&CD33 PE, CD19 PE-Cy7, CD34 PerCP-Cy5.5, CD10 APC, and CD38 APC-H7.
4. Preliminary Reagent Testing.
On receipt, the optimal addition of each fluorochrome/antibody pair should be determined by titering. Typically we start by testing the manufacturers suggested addition and two other volumes: e.g. 20μl, 10μl, 5μl, keeping the final staining volume constant and adequate to ultimately accommodate all antibodies in a cocktail. Testing is performed on specimens containing known positive and negative populations. Sometimes it is necessary to include a few other antibodies to identify the populations of interest e.g. for the CD58 titer we added CD19 and CD10 to be able to assess all B-cells and immature B-cells. The goal with these titration studies is to identify the smallest addition that gives the best separation of negative and positive, along with the least background staining.
When the optimal addition amounts have been determined, optimal compensation settings are established for each fluorochrome/antibody pair. Using these settings, the fluorochrome/antibody combination is initially tested by staining all pairs together and comparing these results with that of unstained cells, each fluorochrome/antibody pair stained separately, and mixtures of all antibody/fluorochrome pairs except one i.e. fluorescence minus one (FMO). This experiment facilitates identification and investigation of potential problems. The table below shows the tubes that were stained for our example combination using a normal bone marrow sample with hematogones (Table 1). The results from this experiment are then initially reviewed using plots that display all acquired events and include all possible antibody combinations.
Table 1: Preliminary Testing of Fluorochrome / Antibody Combinations
Tube |
CD20 V450 |
CD45 V500 |
CD58 FITC |
CD13&CD33 PE |
CD19
PE-Cy7 |
CD34 PerCP-Cy5.5 |
CD10 APC |
CD38 APC-H7 |
1. |
|
|
|
|
|
|
|
|
2. |
X |
X |
X |
X |
X |
X |
X |
X |
3. |
X |
|
|
|
|
|
|
|
4. |
|
X |
|
|
|
|
|
|
5. |
|
|
X |
|
|
|
|
|
6. |
|
|
|
X |
|
|
|
|
7. |
|
|
|
|
X |
|
|
|
8. |
|
|
|
|
|
X |
|
|
9. |
|
|
|
|
|
|
X |
|
10. |
|
|
|
|
|
|
|
X |
11. |
|
X |
X |
X |
X |
X |
X |
X |
12. |
X |
|
X |
X |
X |
X |
X |
X |
13. |
X |
X |
|
X |
X |
X |
X |
X |
14. |
X |
X |
X |
|
X |
X |
X |
X |
15. |
X |
X |
X |
X |
|
X |
X |
X |
16. |
X |
X |
X |
X |
X |
|
X |
X |
17. |
X |
X |
X |
X |
X |
X |
|
X |
18. |
X |
X |
X |
X |
X |
X |
X |
|
Overall the results of from the example tube met our expectations (Figure 1). For this and subsequent figures, the dot plots show all acquired events from a bone marrow containing a heterogeneous mixture of normal cell populations. Granulocytes remain in grey, monocytes are identified using FSC vs SSC and highlighted in purple, all low SSC cells (including lymphoid cells and blasts) are highlighted in red, CD19 positive B-cells are highlighted in dark blue, all hematogones are highlighted in mid blue using staining for CD10, and most immature hematogones are highlighted in light blue using bright staining for CD10. The CD45 versus SSC plot demonstrates separation of cells that is adequate to separate cell populations and identify CD45 dim or negative blasts (Figure 1). Plots of CD19 versus CD10 and CD20 versus CD10 show the expected hematogone maturation pattern. CD19 versus CD34 shows immature CD34 positive hematogones and CD34 positive, CD19 negative, myeloblasts. Mature B-cells demonstrate little staining for CD58 and less mature B-cells show slightly higher staining. It will be important to determine in subsequent experiments using leukemic specimens if this staining for CD58 is adequate to separate abnormal staining of lymphoblasts from hematogones.
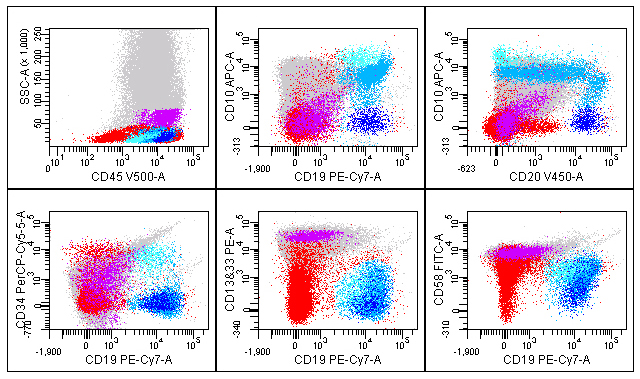
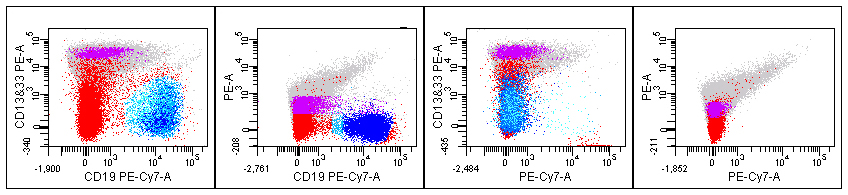
The CD19 versus CD13&CD33 tube shows a potential problem with higher than expected staining of B-cells for these myeloid markers that might limit identification of aberrant staining (Figure 1). This problem was investigated further by viewing the plots of CD19 stain by itself, CD13&CD33 staining alone, the FMO tubes minus CD13&CD33, and unstained cells. In Figure 2 the far left plot shows results from all combinations mixed. The middle left plot from the FMO minus CD13&CD33 tube completely removes the apparent CD13&CD33 staining (Figure 2). The middle right plot from the FMO minus CD19 tube still shows the extra staining, and the right plot of unstained cells just shows autofluorescence (Figure 2). These results indicate that the apparent staining of B-cells for CD13&CD33 derives from the CD13&CD33 reagent, rather than other sources of interference. We plan to confirm that this problem is reproducible, confirm the titre for the CD13 & CD33 reagent, and investigate the unexpected staining by further evaluating the CD13 and CD33 reagents individually. If this does identify the problem, we will consider trying other CD13 & CD33 reagents, such as different antibody clones or isotypes.
Another less than optimal finding for this example tube is higher than expected staining of monocytes for CD34 (Figure 3). The left plot is from the mixture of all 8 reagents and shows some apparent CD34 staining of the monocytes shown in purple. The plot to the right of that from the FMO minus CD34 shows significant spreading of data for CD13&CD33 on monocytes, an issue that not unexpected and is likely exacerbated by the bright intensity of staining (Figure 3). A similar result is seen for the individually stained CD13&CD33 reagent (top right, Figure 3). For the latter two plots the staining is symmetrical about zero and differs from the top left plot that has an upwards shift in the population monocyte population. The unstained cells (lower left) and CD34 reagent only (lower right) show expected results with some autofluorescence of monocytes, and granulocytes (Figure 3). The apparent staining of monocytes for CD34 is of uncertain origin, but will likely not interfere with the purpose of this tube since the cells of interest will be identified by gating on CD19 positive B-cells and monocytes will be excluded.
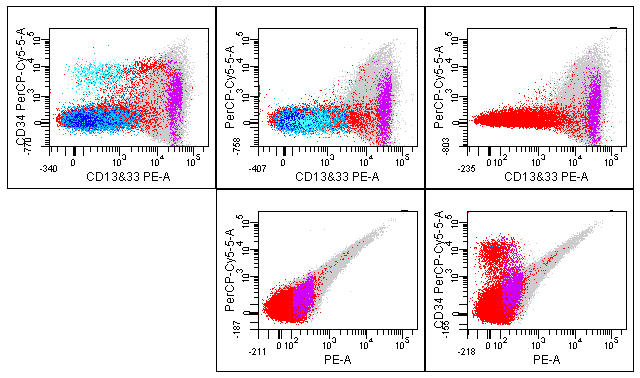
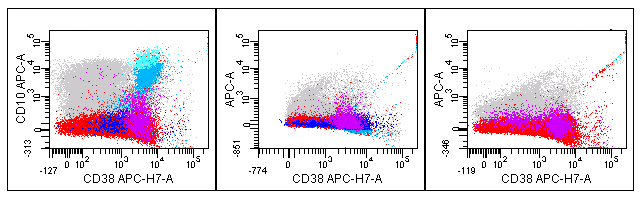
This preliminary experiment also demonstrates some aggregates from the APC- H7 reagent (Figure 4). The number of aggregates varies from tube to tube and is barely perceptible in the plot from the complete 8-color mix (left plot, Figure 4). The center plot from the FMO tube minus APC shows aggregates with APC and APC-H7 staining as seen by a diagonal line of dots (Figure 4). These plots do not appear to show significant tandem breakdown. The APC-H7 reagent stained alone (right plot) also shows the same phenomenon with some apparent APC staining (Figure 4). This is a common finding with this fluorochrome and is unlikely to cause a problem with interpretation, but does appear to have led to less than optimal compensation, as best demonstrated by the lack of symmetry with the singly stained reagent seen in the far right plot (Figure 4).
After the optimal fluorochrome / antibody pairs have been determined, a premixed cocktail will be made and verified in comparison with the individually added reagents. Stability of the cocktail will also be assessed over time, by comparing staining of relevant cell populations with that of individually added antibodies run in parallel on the same specimen and similar populations seen in previously run specimens.
5. Tube Validation and Implementation.
Once the components have been optimized, the tube must be validated prior to implementation in the clinical laboratory. The steps required for validation are the same for a new flow tube as any other clinical laboratory assay: comparison with a gold standard method, determination of sensitivity, specificity, reproducibility, reportable range, reference range, consideration of calibration and control procedures, and documentation of specimen and reagent stability. These steps are more intuitive for quantitative assays, such as CD4 enumeration, but are equally important for leukemia and lymphoma testing. The goal is to document that the assay is meeting expectations and can be relied on for diagnostic testing.
For leukemia and lymphoma testing most of the validation steps can be address by testing specimens known to be positive or negative for the cells/disease of interest. I usually start by testing 20 specimens of each type and add to this if I want to investigate unexpected findings or additional specimen types, anticoagulants, or disease states. The number of false positive and false negative results can be used to calculate the assay sensitivity and specificity. In addition, I critically evaluate the intensity of staining of, and separation of, different populations to detect potential sources of poor performance that might not be covered by the test specimens. It is important to try to select specimens that will evaluate the limitations of the assay. For our MRD assay we should include difficult to identify B-LL, such as CD34 negative and/or CD10 negative. Reproducibility should be performed by repeat staining of a few specimens, including staining performed on sequential days to assess specimen stability. It is important for these studies to include all technologists involved in clinical testing, perhaps as part of their training or competency assessment. For MRD testing, precision and detection sensitivity should be further evaluated using specimens spiked with known proportions of abnormal cells.
At this point in the validation, if not before, it is useful to design an analysis template and consider issues related to interpretation and reporting. Before the test can be implemented the procedure will need to be updated, including any changes to specimen collection or handling, training and competency assessment performed, and proficiency testing addressed. You might also want to perform a cost analysis.
Summary.
In summary, there’s a lot to think about when introducing a new flow cytometric tube. It is important not only to perform these validation steps, but also to have the data available for review by various inspectors. I’ll let you know how the validation testing precedes for our example B-LL MRD tube. I welcome all comments and suggestions.
Fiona E. Craig, MD
University of Pittsburgh Medical Center
craigfe@upmc.edu
Resources:
- Designing and implementing a high-level multicolor flow cytometry assay. Brent Wood. ICCS Web presentation.
- Enumeration of Immunologically defined cell populations by flow cytometry. CLSI H42-A2 Vol. 27, #16.
- Clinical flow cytometric analysis of neoplastic hematolymphoid cells. CLSI H43-A2 vol. 27, no. 11.
- Laboratory instrument implementation, verification and maintenance CLSI GP31-A vol, 29, #11.
- User demonstration of performance for precision and accuracy. CLSI EP15-P, vol. 18, no. 22.
- Flow Cytometry CLIA Compliance manual. Revised for ISAC and CCS. Keeney M and Oldaker T.
- Standardization and QA/QC in Flow Cytometry. Teri Oldaker. Luncheon Workshop. ICCS Annual Meeting.
- OMIPs – Orchestrating Multiplexity in Polychromatic Science. Cytometry, Part A 2010; 77A: 811-812.
|