
Ask an Expert
Back to Categories
What are the principles and methods for daily optical alignment and instrument reliability monitoring?
Daily optical alignment is where the “quality” of Quality Assurance begins in clinical flow cytometry. The CAP checklist requires performance of functional checks on all instruments following a defined schedule (ref: CAP Accreditation Checklist, COM.30600, 2015). For results from a flow cytometer to be reliable and accurate, the setup and monitoring of the optics and proper functioning of the fluidics and electronics should be checked every time the instrument is started up. Some labs may require this as often as once each shift if the instrument is used continuously.
There are two benefits to performing daily optical alignment checks. First, it lets you know if there are instrument operation or mechanical problems, and second, it increases the likelihood of consistent and reliable results. Alignment quality control (QC) begins with the optics of the instrument. Most modern flow cytometers have one or more laser light sources that are focused by a series of mirrors and prisms to a fine focal point at the exit point of the flow cell. If this focal point is not properly aligned, resolution of one or more signals produced as a cell passes through the light will be suboptimal. Most instruments have fixed optics that cannot be adjusted by the user and so adjustment or alignment is usually performed by a service engineer at installation, during scheduled preventative maintenance, or after major service has been performed. In the meantime, however, the alignment or focal point can deteriorate, due to vibration or accidents or other unknown cause. Thus, daily check is essential.
Issues with fluidics are even more common. Usually, these issued are first observed in the light scatter parameters Forward Scatter (FSC) and Side-Scatter (SSC). When properly aligned the FSC / SSC histogram of a lysed blood sample should show at least three distinct populations (see Figure 1).
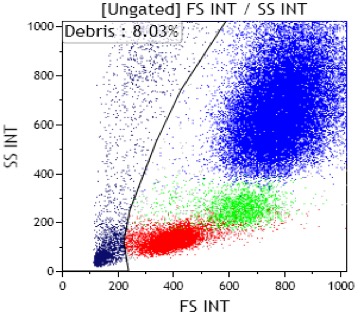
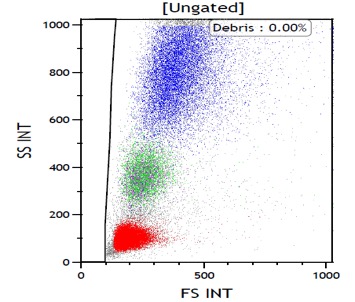
Figure 1 Left Histogram: FSC/ SSC with good optical alignment. Right Histogram: FSC/ SSC histogram with poor optical alignment. Notice the loss of FSC output and SSC resolution.
If the flow cell is dirty due to sample issues, or the stream is obstructed in some way, then the resolution will now appear less defined and separation between populations may be more difficult to visualize. The Forward Scatter Channel (FSC) is usually the first to show this problem. There will either be a gradual loss of the signal resulting in a lower location of a population or an increase in the detector gain if you are using settings that are auto-adjusted by the bead QC software to meet a target range for each peak channel as part of QC. Eventually these changes to the detector settings will exceed the defined limits and the report will indicate one or more failures.
The fluorescence resolution may also suffer when the alignment is not optimal. In a well-performing instrument, the fluorescent channel should give good resolution between peaks with different intensities (see Figure 2). Poor or deteriorated alignment may affect the fine resolution of the fluorescent channels. Instead of tight and disrcete signals the differences in a multi-intensity fluorescence channel will become less obvious resulting in lower sensitivity (see Figure 3).
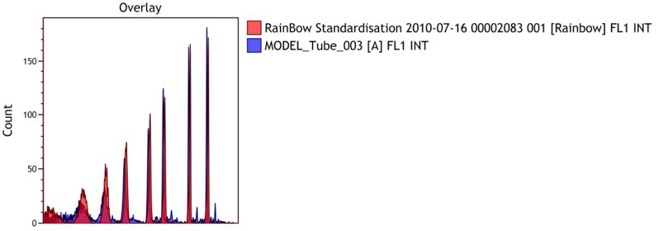
Figure 2: Fluorescent intensities over several channels using Rainbow beads to demonstrate a finely tuned instrument. The resolution of the peaks is sharp and disrcete.
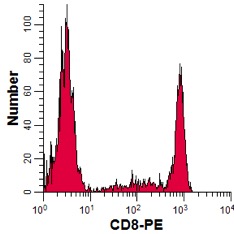
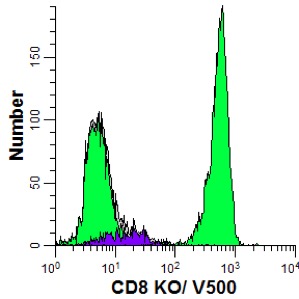
Figure 3: Fluorescent intensities comparison. The histogram on the left has good resolution between the bright, mid-intensity, and negative populations. The histogram on the right has good resolution between bright and mid-intensity but poor resolution between the negative and mid-intensity population.
Daily QC of Alignment and Instrument Performance
To insure that the instrument is properly aligned and each event signal is meeting a set standard, most instrument manufacturers use QC programs that include alignment and setup beads to record and monitor instrument performance including the voltage of the photomultiplier tubes (PMTs) and the output of the lasers. In order to standardize instrument settings on a daily basis, most programs use latex beads or particles that are polychromatic in nature. This produces very sharp, consistent signals for all of the parameters on the instrument (see Figure 4).
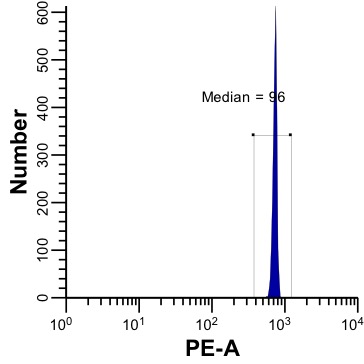
Figure 4: QC Beads run each day are placed in a specific channel by the software. Tolerance limits for each adjustment are set to flag if exceeded.
After establishing baseline calibration settings, the beads are then run each day to monitor performance of the PMTs, lasers, and fluidics over time. Over time, there can be a gradual decrease in performance in any of the electronics or lasers that may predict a future failure. Most instrument QC programs include graphical displays of daily results plotted over time (such as Levy-Jennings charts) that allow the user to observe changes, trends, or outliers. (see Figure 5)

Figure 5: Levy-Jennings Graph of PMT Voltage over Time.
The example shown demonstrates a gradual rise in the PMT voltage required to place the bead signal within the desired range over several days. If this is the only detector showing this trend then the problem may be a faulty PMT. If more than one detector from the same laser shows this problem it may indicate that the laser is gradually deteriorating. If more than one parameter is out over multiple lasers then the problem is probably with either the fluidics or the flow cell. If the settings are greater than what is acceptable the software will flag the results as being unacceptable or failed. Each lab should determine how and when to respond to a QC failure. In some cases, performing a system clean of the fluidics and flow cell will often fix the problem since this is the most frequent cause of instrument QC errors.
Conclusion
Daily monitoring of instrument performance including alignment checks, background and sensitivity limits, fluidics, PMT and laser output, is a standard of practice in flow cytometry laboratories. It meets the requirements of several regulatory checklists and helps insure consistency on a day-to-day basis. By tracking the results over time it may reveal trends that could predict future instrument problems. Understanding how each aspect of the instrument, the fluidics, the optics, alignment and the electronics helps insure that results are reliable and consistent.
Author: Bruce Greig