Ask an Expert
Back to Categories
How is sensitivity defined in rare event analysis?
Stated in simple terms, sensitivity is defined as the ability of the assay to distinguish signal from background and precisely measure low amounts of the measurand. For assays designed to measure rare event analysis defined as occurring at frequencies of ≤1% such as PNH or other, it is necessary to establish the limit of blank (LOB)/limit of detection (LOD) and the lower limit of quantification (LLOQ).
- "Background": The LOB is defined as the highest apparent signal expected in the absence of the measurand (i.e. a blank sample), whereas; the limit of detection (LOD) is defined as the ability to detect the measurand at a level that can reliably be distinguished from the LOB where 95% of low levels samples will be detected above the LOB. LOB is calculated as the Mean of the blank + 1.645 SD.
- "Analytical sensitivity": The LOD can be calculated as the Mean of the blank + 3 SD. Using PNH assay as an example, 10 normal samples should be used for the LOB/LOD determination, acquiring up to 1 million gated events.
- "Functional Sensitivity: The LLOQ is defined as the lowest concentration that can be reliably detected with acceptable accuracy and precision. For flow cytometric methods, the LLOQ can be established by analyzing samples with levels of the measurand approaching the LOB/LOD.
The acceptance criteria for assay imprecision are determined by the intended use of the data. Although assay imprecision in the range of 20-35 percent coefficient of variation (CV) has been reported to be acceptable at the LLOQ of flow cytometric biomarker methods, each laboratory must determine the tolerability limits appropriate for each assay and define it in the Method Validation Plan. Typically, the minimum required number of events is somewhere between 50 and 100; although again this depends on the intended use of the assay and the experience of the laboratory.
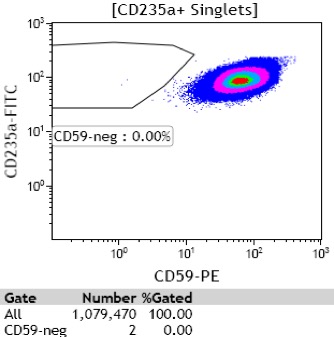
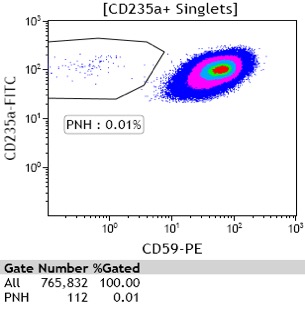
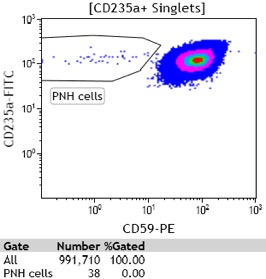
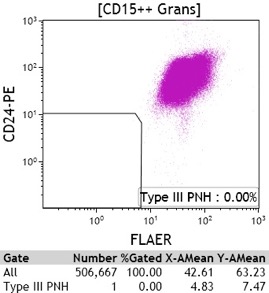
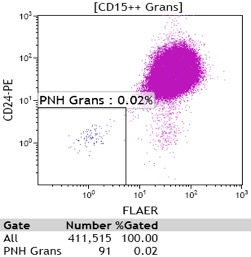
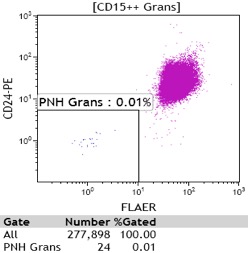
The Figure below shows an example of a RBC assay from a normal patient showing a background level (LOB) of 2 PNH phenotypes/1,079,470 gated events (A), a patient with the presence of rare (0.01%) but quantifiable PNH cells with more than 50 PNH cells (B) and a patient with rare PNH cells (more than 20 PNH cells but less than 50 PNH cells) which is detectable but not quantifiable (C). This is also illustrated for neutrophils, which shows an example of a normal sample showing a background level (LOB) of 1 PNH phenotype/506,667 gated events (D), a patient with the presence of rare (0.02%) but quantifiable PNH cells with more than 50 PNH cells (E) and a patient with rare PNH cells (more than 20 PNH cells but less than 50 PNH cells) which is detectable but not quantifiable (F).
|
|
|
A: Example of a normal donor showing 2 PNH phenotypes per 1,079,470 CD235a+ RBCs (0.0002%) |
B: Example of a patient with 112 PNH cells per 765,832 CD235a+ RBCs (0.01%) |
C: Example of a patient below the LLOQ (< than 50 PNH cells) but above the LOD (>20 PNH cells) showing 38 PNH cells/991,710 CD235a+ RBCs |
|
|
|
D: Example of a normal donor showing 1 PNH phenotype per 506,667 CD15+ neutrophils (0.0002%) |
E: Example of a patient with 91 PNH cells per 411,515 CD15+ neutrophils (0.02%) |
F: Example of a patient below the LLOQ (< than 50 PNH cells) but above the LOD (>20 PNH cells) showing 24 PNH cells/277,898 CD15+ neutrophils |
References:
- ICCS/ESCCA Guidelines for PNH Testing in Paroxysmal Nocturnal Hemoglobinuria (PNH and Related Disorders (in press, to be published Jan 2018)
- Davis BH, Wood B, Oldaker T, Barnett D. Validation of cell-based fluorescence assays: practice guidelines from the ICSH and ICCS, Cytometry B Clin Cytom 2013 84B: 291-308
Author: Andrea Illingworth, MS