What are other cellular populations that may fall in the SCC vs CD45 dim area but are not blasts CD34 positive?
The analysis strategy of using SSC vs CD45 dot plot is quite useful and commonly used to identify and classify bone marrow and peripheral blood cell populations into five commonly gated areas that are often described as:
1) Lymphocyte gate
2) Monocyte gate
3) Granulocyte gate
4) CD45-dim area
5) CD45-negative or very dim area.
The CD45-dim area is where normal blasts and a great number of neoplastic blasts will usually be present. However, this gated area has been termed by the French flow cytometry group
Bermudes"
, referencing the Bermuda Triangle in the Caribbean Sea where boats get lost, because a great number of other normal and abnormal populations can also be present in this area. A comprehensive list of these populations and events is provided below. However, before going over this list it is important to go over some additional concepts to better answer this question.
In regards to the nature of blasts:
Not all blasts are CD34-positive. Neoplastic blasts can often have partial or even negative expression for CD34; good examples of CD34-negative blasts include monoblasts in Acute Monocytic Leukemia and blast equivalent promyelocytes in Acute Promyelocytic Leukemia.
Blasts can be present outside the CD45-dim area. For example, monoblasts in Acute Monocytic Leukemia will usually be in the
Monocyte gate"
and lymphoblasts in B-cell Acute Lymphoblastic Leukemia will usually be in the
CD45-negative or very dim area"
.
In regards to analysis strategies:
Gated areas are often comprised of varied heterogeneous populations. They can often be contaminated by unexpected abnormal populations. An analysis strategy that uses a combination of gating and display dot plots and/or additional sequential gating or backgating strategies to verify the accuracy of the gates and the populations identified is recommended.
It is good practice to identify and classify all the events into different populations in your analysis.
Showing all events in dot plots with SSC vs all the fluorochromes in your assay in a single page can be helpful as quality control for your antibodies, the settings of your assay, and your analysis strategy. (see figure 2)
In regards to the relevance and significance of flow cytometry results:
Flow cytometry can be a helpful and useful method to identify normal and neoplastic blasts and provide relative quantitation. However, for diagnostic purposes blasts should still be best quantified by morphological assessment. A flow cytometry strategy that only uses the CD45-dim area with or without CD34 can underestimate or overestimate the number of blasts.
Variability between the morphological and flow cytometric blast estimate exists due to sample hemodilution and to changes in the proportion of the populations due to sample processing (lysing and washes).
The CD45-dim area is often the gating strategy used to identify and phenotype blasts in multiple tubes and is useful and convenient in most samples. However, one should consider the presence of
non blasts"
as possible heterogeneous populations in this CD45-dim area in order to avoid erroneous results. This is particularly significant if this region is the only gating strategy used to phenotype blasts. This can be particularly difficult in abnormal or dysplastic samples.
After the above concepts have been considered and understood, the following is a comprehensive list of the possible events that can fall in the CD45-dim area.
Blasts (normal and neoplastic)
Granulocytes (dysplastic)
Lymphocytes (neoplastic B- or T-cells such as CLL and DLBCL)
Hematogones (Immature B-cells. Of note, these cells may or may not be arbitrarily considered as blasts by flow cytometry evaluation and morphological correlation)
Erythroid cells (Pronormoblasts)
Monocytes (normal or neoplastic)
Basophils (can be significantly increased in some neoplastic and reactive conditions)
Plasma cells (normal and neoplastic)
Plasmacytoid dendritic cells
Platelets and debris (limited literature is available in this topic but this can be a significant problematic issue)
Harrington et al report that blasts averaged only 20% of events inside the CD45 dim 'blast gate' and that 10-20% of blasts may fall outside of this region, particularly in MDS and CMML (ref 2). Arnoulet et al and the French flow cytometry group describe an excellent backgating analysis strategy and coin the term
Bermudes"
for this CD45 dim area in their paper
Four- and five-color flow cytometry analysis of leukocyte differentiation pathways in normal bone marrow: A reference document based on a systematic approach by the GTLLF and GEIL"
(ref 1) .
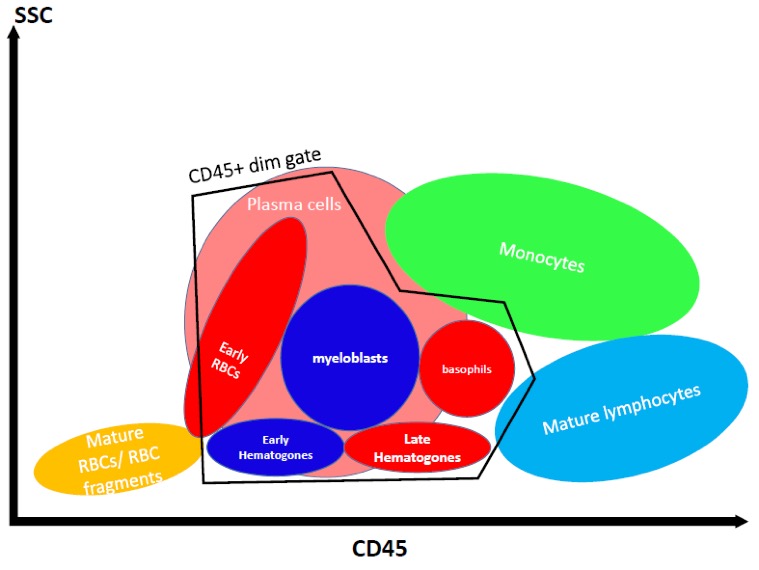
A cartoon diagram depicting the CD45 dim area and one example case with dot plots that showcases a significant overlap in the dim CD45 area between basophils and blasts.
Cartoon Diagram of the CD45 dim area. Figure 1: Cartoon diagram of the CD45 dim area provided by Dr George Deeb.
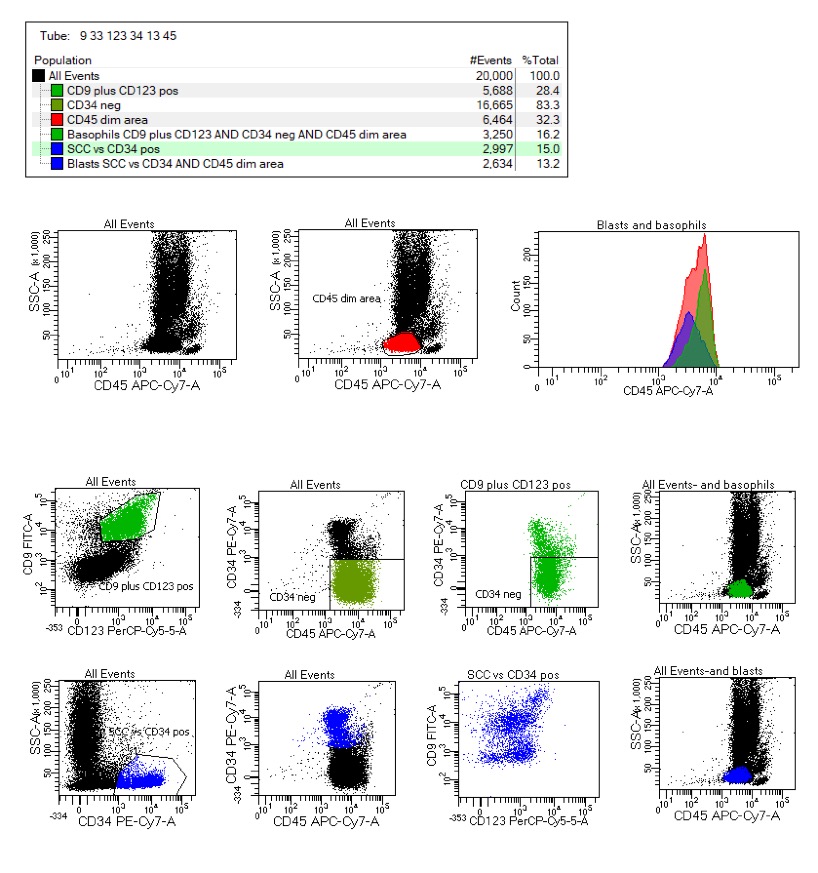
Example of a peripheral blood sample with basophils and blasts in the CD45 dim area. Figure 2: This is a peripheral blood sample with basophilia and blasts in a patient with Chronic Myeloid Leukemia. This is a single six color tube assay with the following antibodies: CD9 / CD33 / 123 / CD34 / CD13 / CD45.
In the analysis, the dim CD45 area is painted red. The basophils painted green have been identified by their positive expression for CD9 and CD123; the lack of CD34 expression; and their location in the dim CD45 area. Blasts painted blue have been identified in this case by their positive expression for CD34 and their location in the dim CD45 area.
The dim CD45 area represents 32.3% of events. The basophils represent 16.2% of events. The blasts represent 13.2% of events. The sum of the basophils and the blasts is 29.4% of events. Therefore, in the dim CD45 area there are 2.9% of events that have not been identified in this analysis strategy.
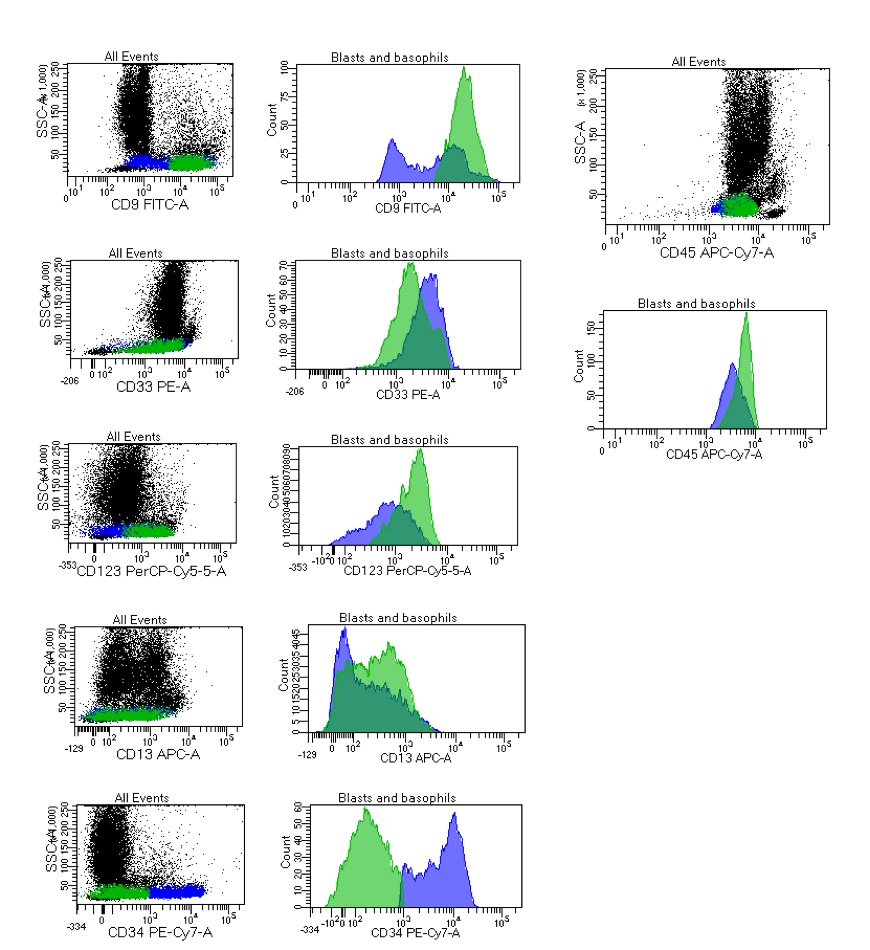
Dot plots of SCC vs all FL channels with all events and histograms that show the overlap of expression between the basophils and the blasts are provided.
This case highlights the heterogeneity of the CD45 dim area with two distinct separate large populations. There is both a large population of basophils and a large population of blasts. The corresponding WBC was of 120.75 x 10e9/L with a morphological blast count of 11% and a basophil count of 33%. Please note that both the flow cytometric and the morphological assessment were relatively difficult in this case and although they did not entirely match were complementary for each other.
References
1) Arnoulet C, Bene MC, Durrieu F, Feuillard J, Fossat C, Husson B, Jouault H, Maynadie M, Lacombe F. Four- and five-color flow cytometry analysis of leukocyte differentiation pathways in normal bone marrow: A reference document based on a systematic approach by the GTLLF and GEIL. Cytometry Part B 2010; 78B: 3-10. PMID: 19708072
2) Harrington AM, Olteanu H, Kroft SH. A dissection of the CD45/side scatter "blast gate". Am J Clin Pathol. 2012 May;137(5):800-4. PMID: 22523220.